 A good infographic is worth a thousand words. With infographics, complex information is simplified; a boring subject is turned into a captivating experience. Using visually-engaging and clear infographics to inform your message is always effective in drawing your audiences’ attention, and thus helps establish your business presence.
Why are Infographics Necessary?
Humans are visual animals. Our brains process images 60,000 times faster than text, and we usually remember visuals than text. That’s why infographics are necessary to everyone who is eager to learn about something without going through a heavy reading load, and it comes as no surprise that people are opting for information visualization nowadays.
Power of Infographics
The power of infographics is not to be neglected. People enjoy reading infographics because it consumes much less time than reading a text-based content, and infographics are generally short, useful and accurate. A lot of businesses have been sharing more infographics because there is an increased engagement on these visual contents.
An infographic that resonates with your audience receives three times more likes and shares than other media types, as Hubspot suggests. Therefore, if you are hoping to grow your social audience, infographics could be one of the ways. Plus, a savvy and well-executed infographic that breaks down a difficult topic could showcase your brand’s skills and your brand as an authority in your industry, which helps grow your brand’s influence. No matter how you would love to grow your brand, infographics can show you the way.
Types of Infographics and When to Use them
Using the right type of infographic that perfectly suits your objective and topics can help take your brand to the next level. Let us show your how.
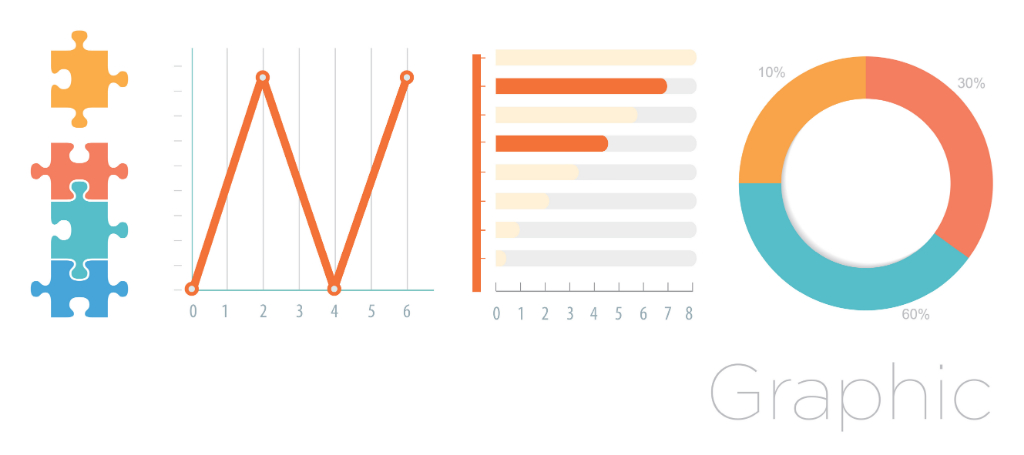
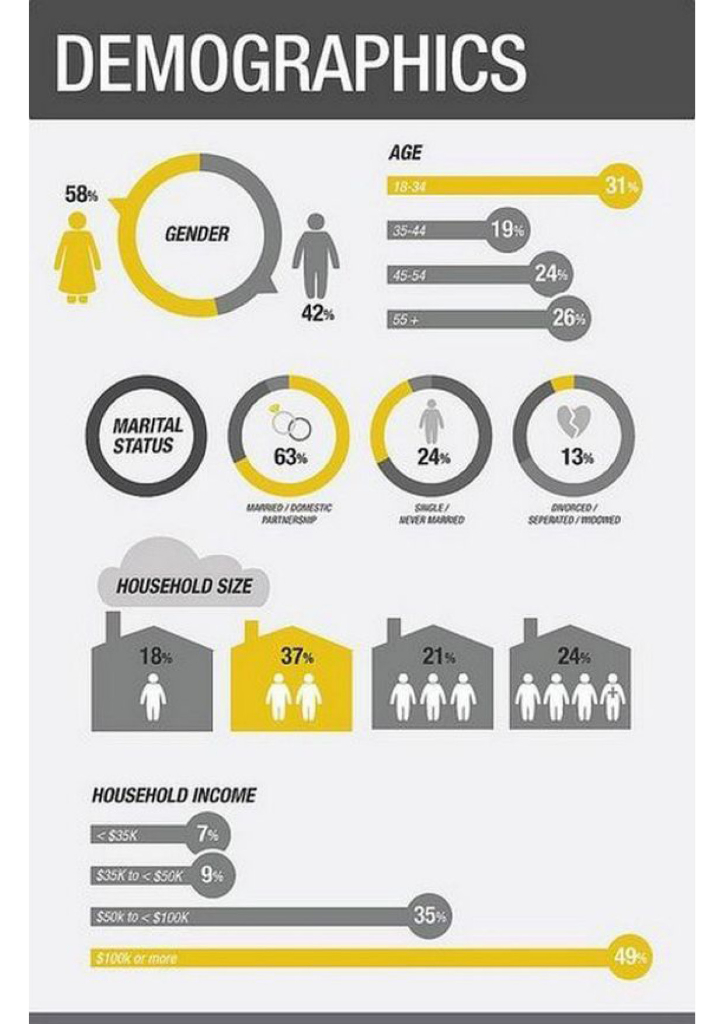
1) Statistical Infographic
Statistical infographic is one of the most common type of infographics, which helps present your data in an intriguing way or backup your argument with visualised data. For example, if you are to persuade your clients how your service is worth it with numerical information, you may want to use statistical infographics.

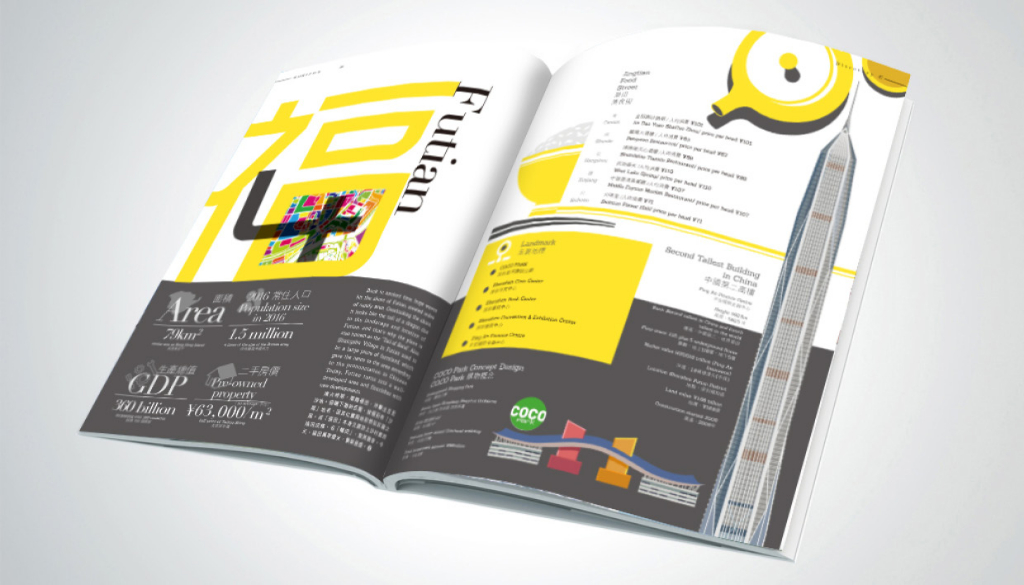
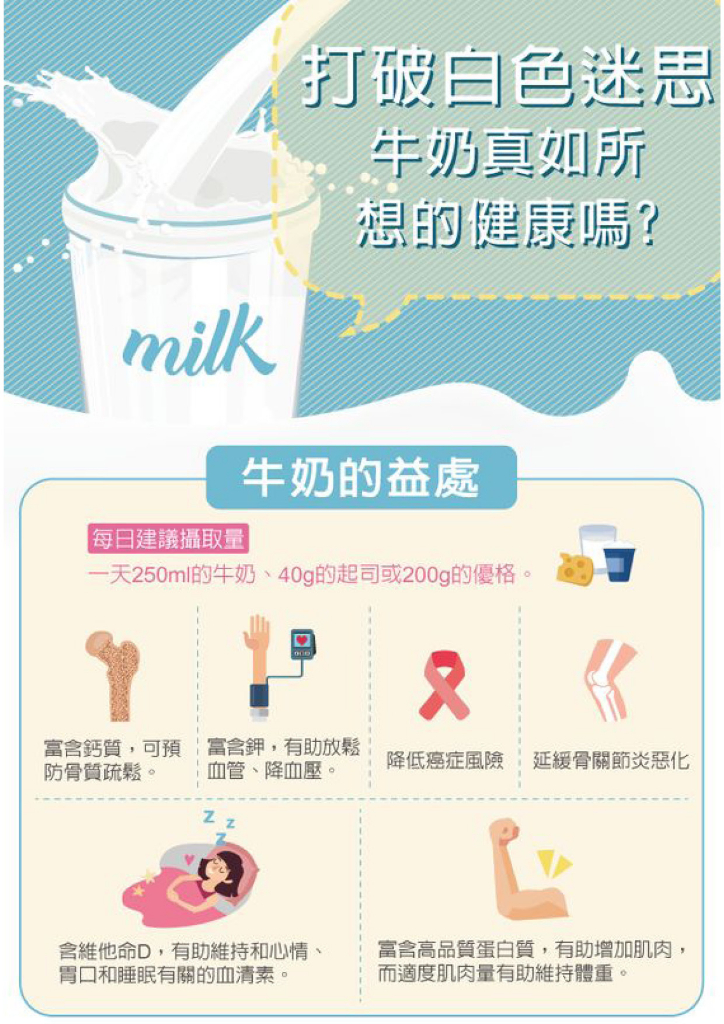
2) Informational Infographic
To convey text-based information, informational infographics would suit your needs best. An informational infographic has a clear structure comprised of different sections with headers, completed by icons, charts, numbers and images, altogether guiding the readers to read from one point to the next.

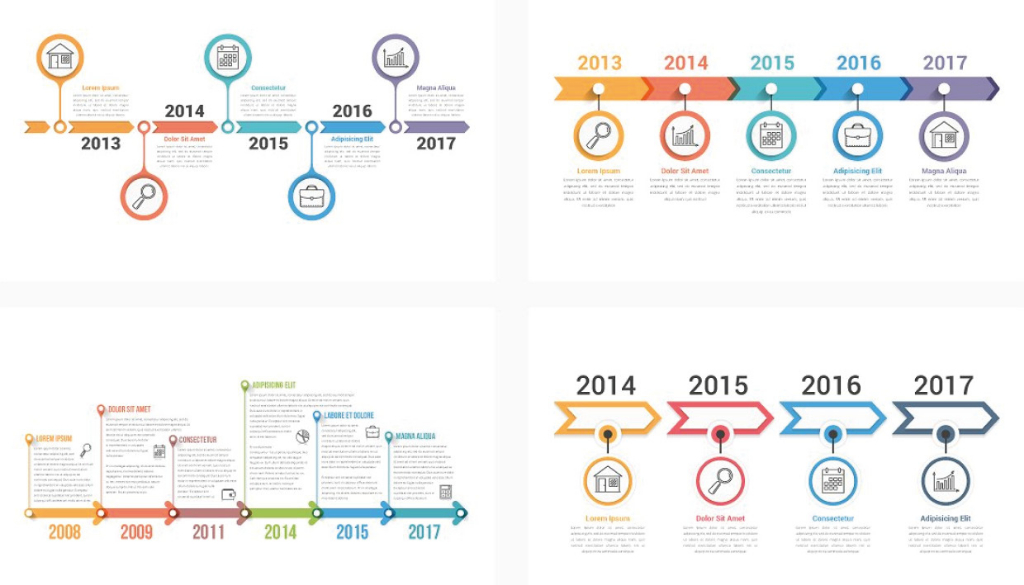
3) Timeline Infographic
If you are finding the perfect way to inform your audience about multiple events, the history of your business, or what happens over a certain period of time, then you should consider using a timeline to lay everything out. Whether complex or simplified, a timeline should always have its points in time clearly labelled with a brief description and an icon to visualise the event.
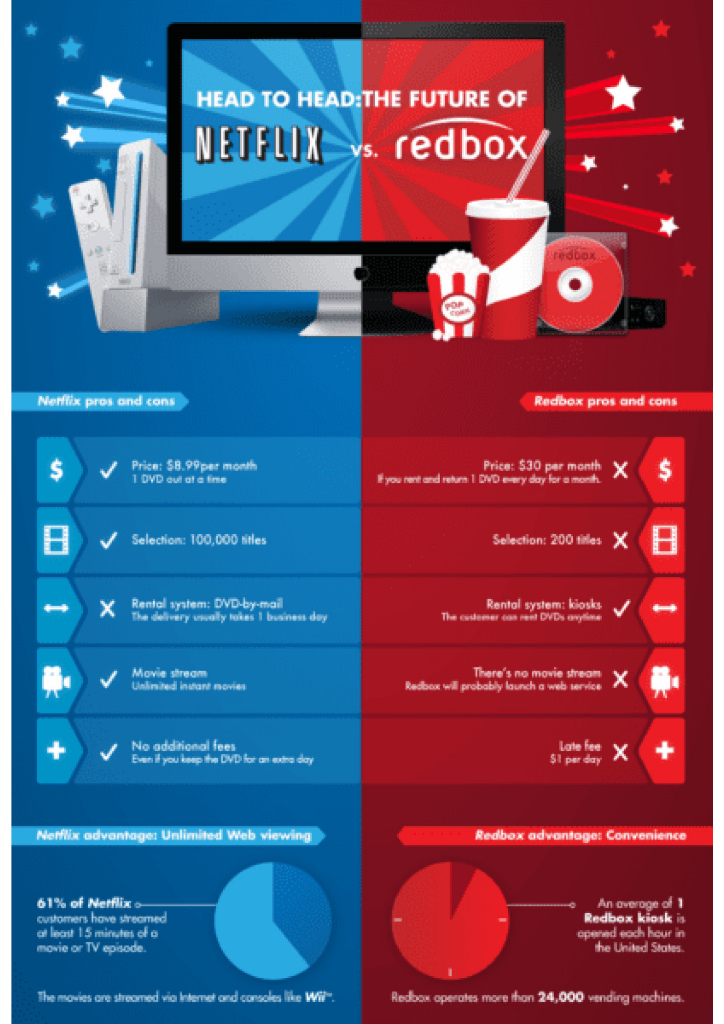
4) Comparison Infographic
Comparison data can be laid out in a text-based table, but with infographics, it just makes everything easier to understand, especially when you have several groups of information to compare with. Comparison Infographics are effective in showing the similarities and differences, pros and cons and other options between products, services, places, plans, etc.

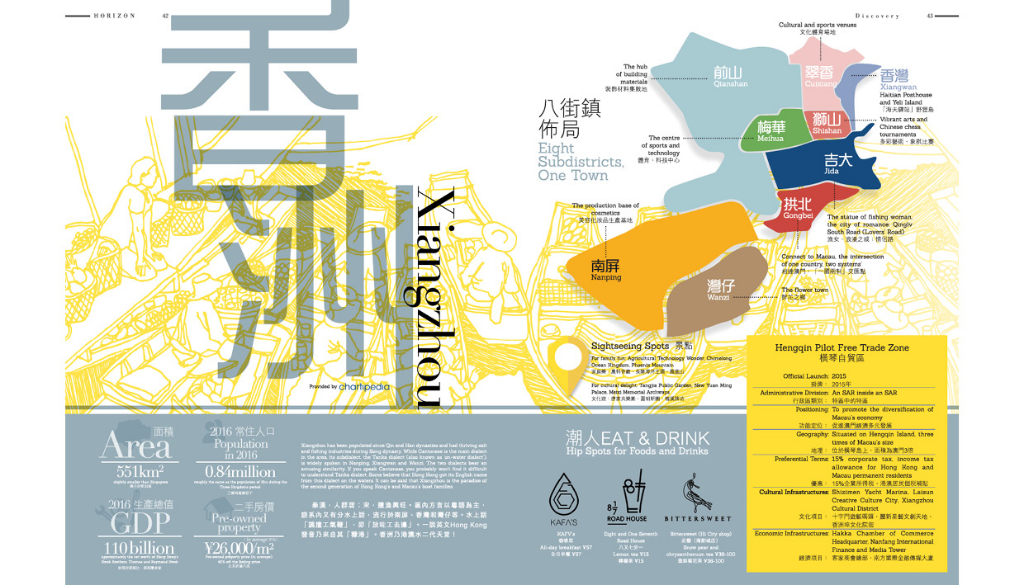
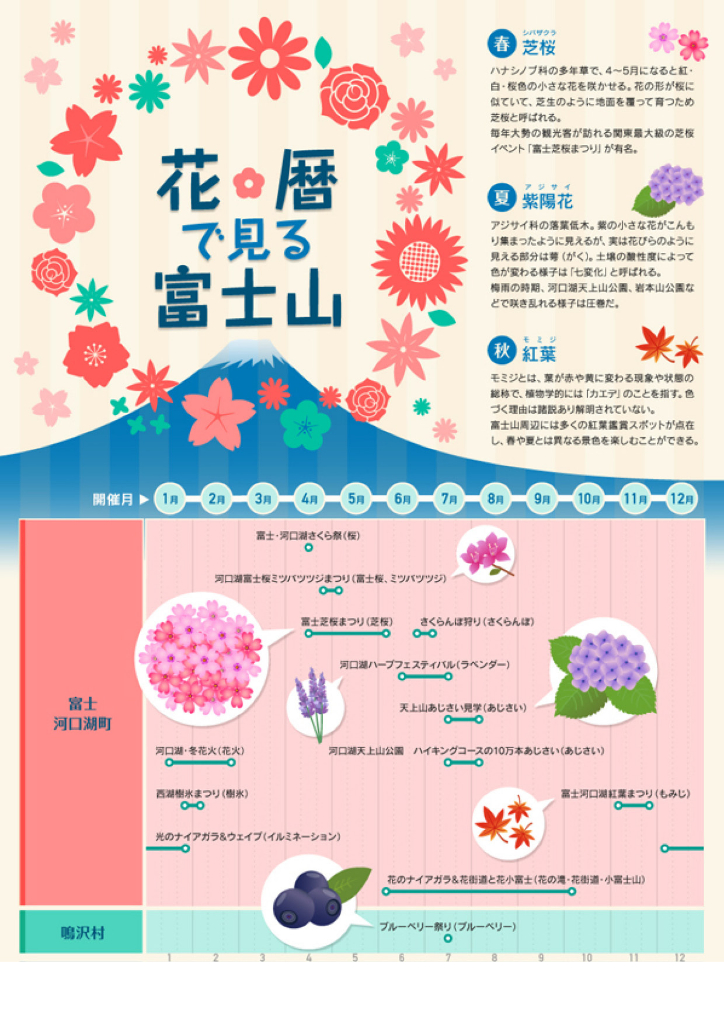
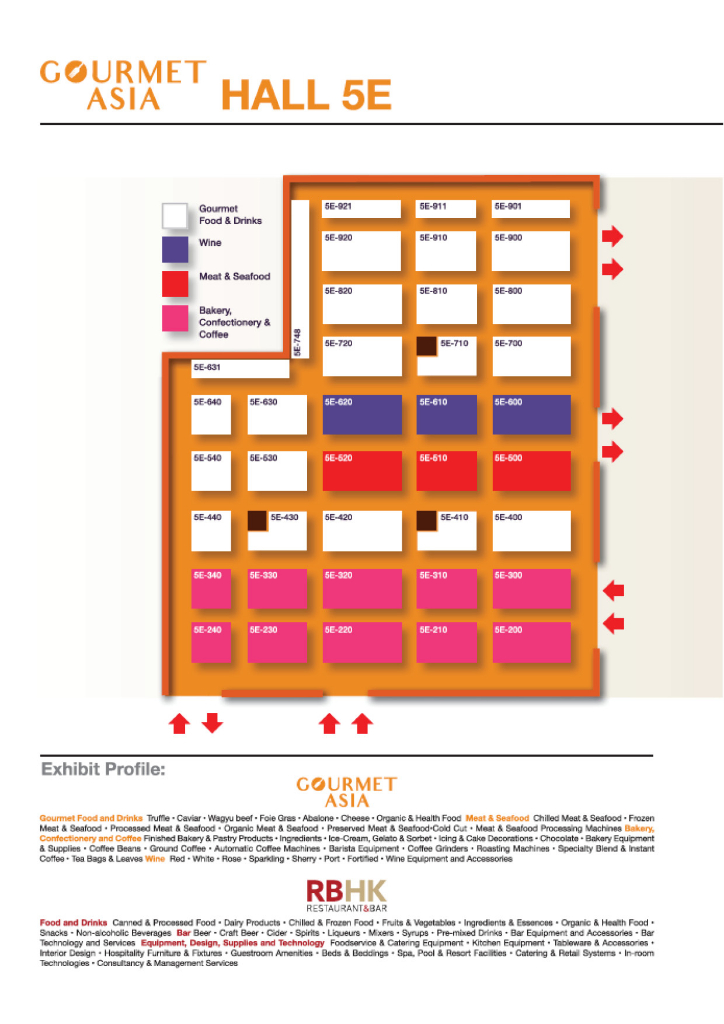
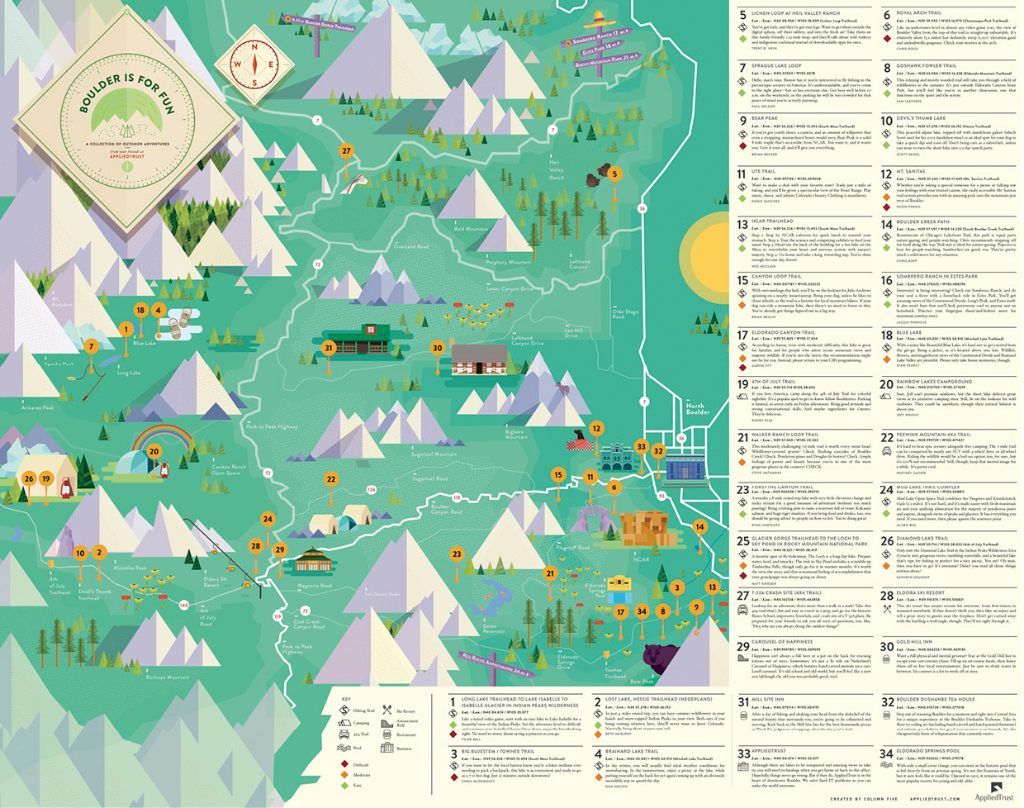
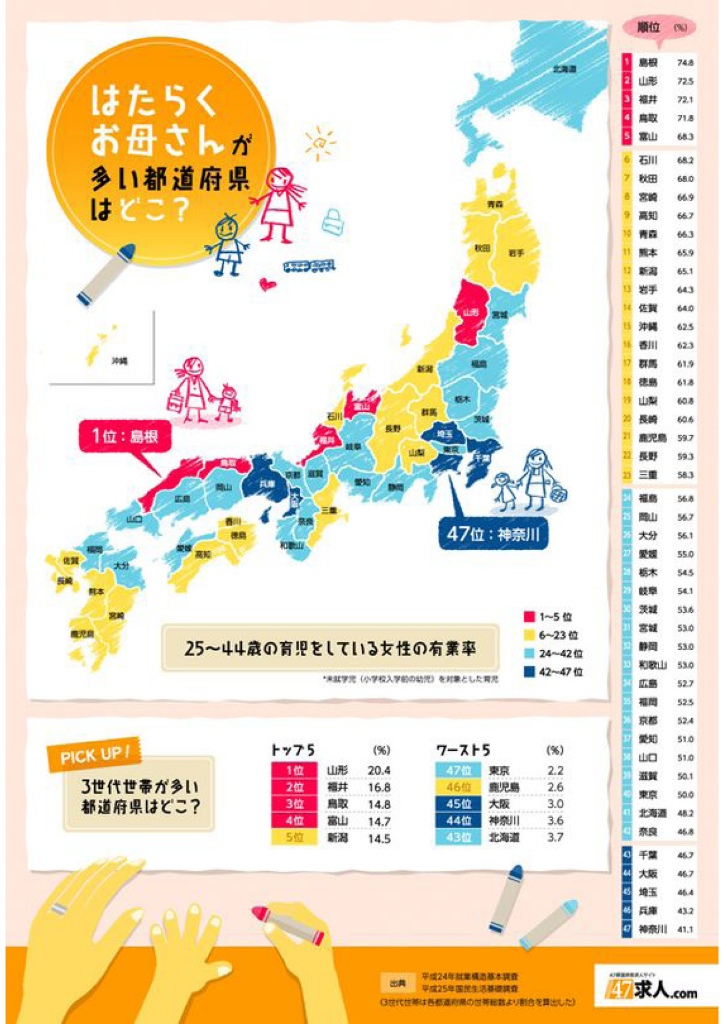
5) Geographic Infographic
We use geographic infographics to visualise location-based data. Common examples include maps and map charts. They show population, regional facilities, statistics, or other regional information using colour shades, icons or other visual elements. To give you an idea, you will need an aesthetic and practical geographical infographic for exhibitions, carnivals or other large-scale events.
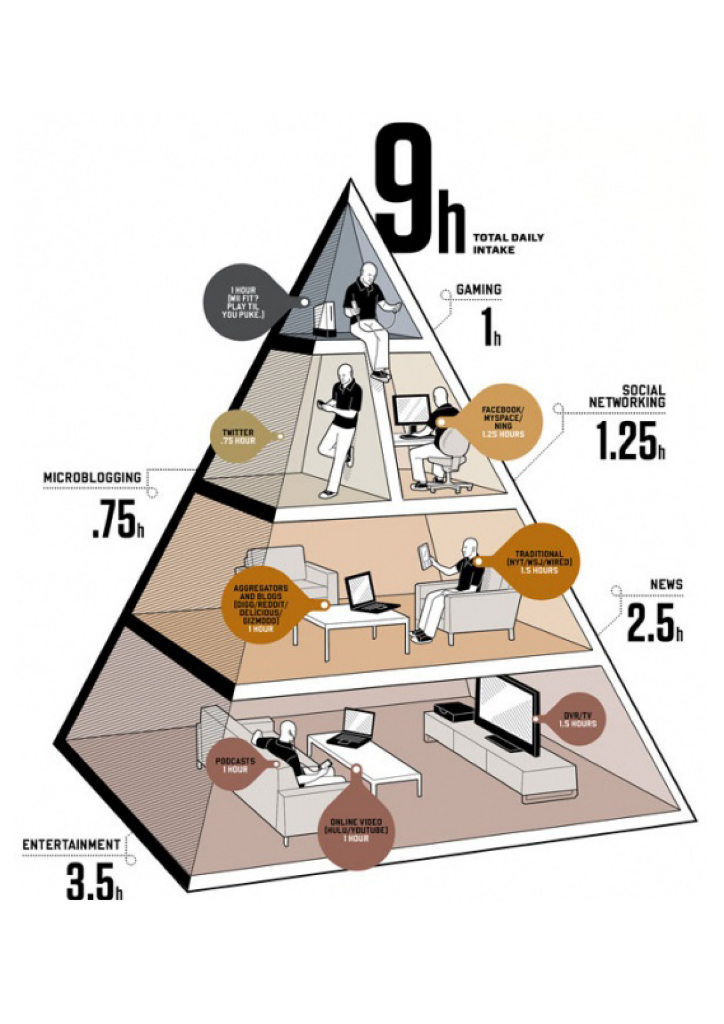
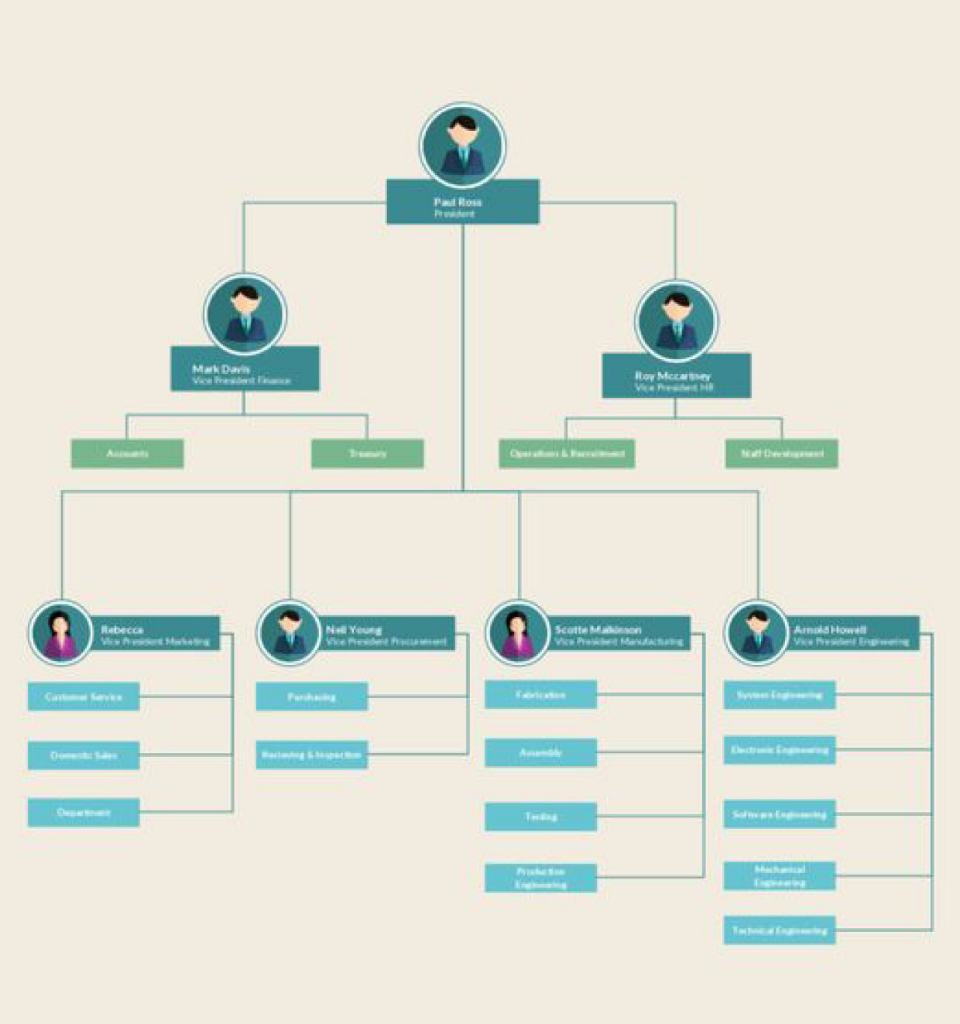
6) Hierarchical infographic
Hierarchical infographics organise information into different levels and show how the levels connect with one another, e.g., an organisation chart shows the internal structure and the relative ranks of its positions. The common hierarchical infographics visualise information with a pyramid or a flow chart.
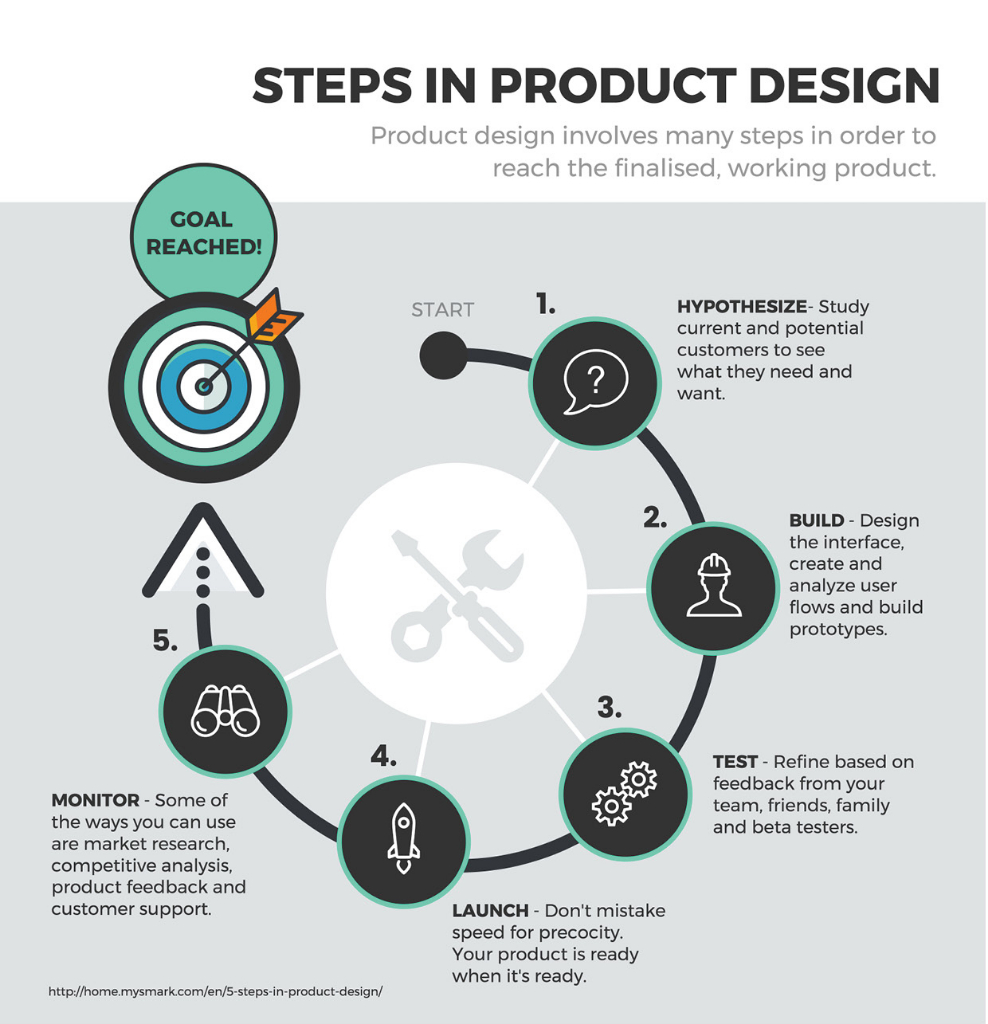
7) Process Infographic
Pretend you would love to show your clients how detail-minded you are when handling the project or how much efforts are put into your service or products, process infographics are your final destination because they help visualise, simplify and summarise a complex process.

————————————
Using infographics can make a difference. If you need our help with creating attractive and functional infographics for your projects, feel free to contact us at 3460 5052 or info@ccplusmedia.com